4th Grade Performance Task
Contributed by: New York State Education Department (NYSED)
NYS Alternative Assessment in Science Project (1996)
Mystery Card 3 - Scoring Rubric
| 4. Data Table |
1 point total
|
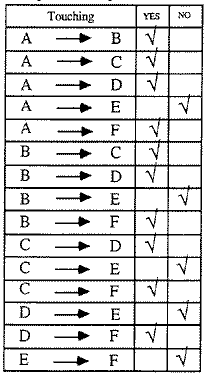
Standard: The student tests the circles on the mystery
card and correctly indicates which connection made the bulb
light or not light.
Criteria:
*** Credit should be given even if some check
marks are incorrect.
*** No credit is given if the table is incomplete.
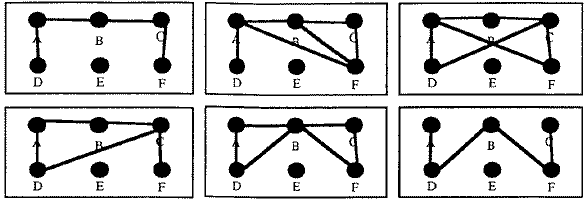
Example of completed data table
Standard: The student makes a valid drawing based on
his/her data from question #4.
Criteria:
- 1 point for a drawing that correlates correctly to the student's
data table.
*** The student still receives 1 point if their drawing correlates
with their data table even if the data in their table is incorrect.
*** Some example drawings are shown on the next page. Obviously
there are others. The rater will have to be sure that tthe student
data table and drawings correlate with one another.
| 6. Using given data table to draw a diagram
for card #2 |
1 point total
|
Standard: The student makes a valid drawing based on
the data in the table for card 2.
Criteria:
- 1 point for a drawing that correlates correctly with the data
in the table for card 2.
*** Some example drawings are shown below. Obviouslythere are
others. The rater will have to be sure that the data table and
the drawings correlate with one another.

| 7. Circuit diagram for card #2 |
1 point total
|
Standard: The student will decide whether or not the given
drawing could be possible for mystery card 2.
Criteria:
- 1 point for a correct answer - YES
| 8. Explain use of given data table to answer
questions #6 & 7 |
1 point total
|
Standard: The student explains how the chart helped them
to make their drawings.
Criteria:
- 1 point for a reasonable explanation telling that the student
looked at the entries in the data table to draw the diagram.
- Even if the student's drawing is incorrect, he/she may still
be able to explain the use of the data table.
|
Highest possible score - 5 points
|
Scoring Form - Mystery Card 3
Student ID _______________
Male / Female (circle one)
Circle the student's score for each question. Add
the points for each question and write the total score at the bottom
of the scoring form.
| 4. Data Table |
0
|
1
|
| 5. Diagram |
0
|
1
|
| 6. Using given data table to draw a diagram for
card #2 |
0
|
1
|
| 7. Circuit diagram for card #2 |
0
|
1
|
| 8. Explain use of given data table to answer questions
#6 & 7 |
0
|
1
|
Total Score _____________
Total possible score - 5 points
|