 |
 |
|
|
|
|
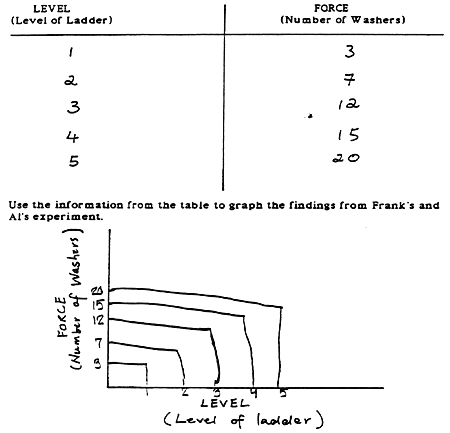
Student #1 The following graph would receive a score of 2 points.
Frank and Al wrote down their results in the table below. 
Next Student Work |
|
|||||||||||||
|
|||||||||||||
| |
|||||||||||||
| Incline | |||||||||||||
|
Examples of Student Work |
|||||||||||||
|
|||||||||||||
| |
|||||||||||||
|
|