 |
 |
|
|
|
TO THE STUDENTYou may be part of a group for the first part of this exericse. Each group should carry out the experiment and collect the data together, but each student must record the data in his or her own booklet. Be sure to record the data exactly as you observe them. After the data has been collected, each student should answer the questions independently. After you have finished your experiment and have recorded all of the data, you will be asked to answer some questions about the experiment and the data you recorded. Your answers must be written in this test booklet in the space provided. Make sure that you understand each question before you begin to write. At any time while you are writing your answers, you may look back to the directions for the experiment and the data you collected. Be sure that your answers are written as clearly and neatly as possible. Before you turn the page, read the list of materials given below and check to make sure that your group has everything listed.
AFTER YOU HAVE READ THE DIRECTIONS, TURN TO THE NEXT PAGE AND BEGIN.
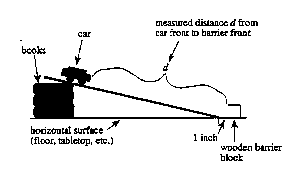
Cars are the most common means of transportation in this country. Although driving is usually safe, accidents do occur because of unsafe driving practices (such as speeding) or unsafe road conditions. Accordingly, car manufacturers have spent millions of dollars in an attempt to make cars safer to drive. The laws of physics describe the interaction of force, mass, and acceleration in a collision. In this event you will use a model system to investigate how the speed of a car affects the results of the collision of the car with a barrier. You will be varying the location on a ramp from which a car starts to roll. Work in groups of four.
Note: To calculate speed, divide the distance the car traveled by the time on the stopwatch (S=D/T). To calculate the average speed, add the speeds together and divide by two. Use this same method to calculate the average distance the barrier moved.
1. Record the data that your group collected in the space below. Include a description of the procedures that your group used to perform your study. This description should be clear and complete enough so that someone could easily repeat your study. ___________________________________________________________________ ___________________________________________________________________ ___________________________________________________________________ ___________________________________________________________________ 2. Discuss any conclusions that you may draw from the data you collected. Include in your answer a discussion of whether you believe your results are an accurate reflection of the relationship between the speed of the car and the distance the barrier moved. Be sure to justify your answer. ___________________________________________________________________ ___________________________________________________________________ ___________________________________________________________________ ___________________________________________________________________
|
