|
Contributed by: The RAND Institute (RAND)
Radiation Performance Assessment
"MESSING AROUND"
Group Activity Card |
The Sunshine Construction Company has asked you, as skilled science
students, for information on the following problem:
Find a way to accurately measure how quickly an object painted
a certain color heats up.
To investigate this problem, your group will be able to use the
following materials:
| Your group should have the following materials: |
Your teacher will supply the entire class with the
following materials: |
- 1 group answer sheet
- 1 Celsius thermometer
- 1 watch with second hand or stopwatch
- 1 250- ml beaker
- 1 400- ml beaker
- 1 100-ml graduated cylinder
- 1 test tube, painted blue
- 1 test tube rack
- 1 support stand and rod (ring stand)
- 1 reflector lamp
- 1 150- watt light bulb
- 1 metric ruler
|
- water supply from faucet or container labeled "tap Water."
- safety goggles for every student
- paper towels (or other drying material)
|
FACILITATOR: Before the group "messes around" with the equipment,
ask each group member (including yourself) the questions below. Be
sure that everyone answers a question before going on to the next
question. Start with a different person each time you go to a new
question. Your group's RECORDER will take brief notes
on the GROUP ANSWER SHEET.
- What ideas do you have about how to measure how quickly the
water heats up, using the equipment provided?
- Do you think it will make a difference where you hold
the end of the thermometer in the test tube?
- How will you measure the rate of heating for the test
tube? What units will you use?
- Do you think that the rate of heating will depend on how much
water is in the test tube? If so, how?
After answering these questions, guide your group in "messing
around" with the equipment. Try out as many of the group's ideas
as possible.
CAUTION:
Avoid touching the Reflector lamp and the Light Bulb
- they can get very hot!!! Also, if water hits the surface of
the heated light bulb it may explode.
KEEP WATER AWAY FROM THE LAMP
AND WEAR SAFETY GOGGLES AT ALL TIMES !!!
|
Radiation Performance Assessment
EXPERIMENTAL DESIGN
Student Instruction Sheet |
You have recently been presented with a situation which can be
approached scientifically. The Sunshine Construction Company has
asked you, as a skilled science student, for information on the
following problem:
Given a choice of buildings painted in one of three different
colors, which color would do the best job of keeping the inside
of the building from heating up quickly under the hot sun?
As explained earlier, the equipment available to investigate this
problem includes:
- 1 reflector lamp with a 150- watt light bulb
- 3 test tubes, each painted a different color
- 1 test tube rack
- Tap water
- 1 Celsius thermometer
- 1 watch with second hand or stopwatch
- Additional materials: beakers, graduated cylinder, 1 metric
ruler, paper towels and safety goggles.
Your task is to design an experiment to solve the problem using
this equipment. You must explain how to use the equipment
to measure the rate of heating of water placed in the test
tubes.
When instructed to do so, answer the questions on your Student
Answer Sheet.
| When the time is up, turn in this sheet and your Student
Answer Sheet as directed by your instructor. |
Radiation Performance Assessment
EXPERIMENTAL DESIGN
Student Answer Sheet |
Read through this table carefully, and use it to help you write
answers that are CLEAR, PRECISE, and COMPLETE.
| GUIDING QUESTION(S) |
CAUTIONS |
| CLEAR |
WRITING |
DRAWING |
- Can another student understand what you've written or
drawn?
|
- Answer in complete sentences when appropriate
|
- Avoid crowding
- Erase completely
|
| PRECISE |
WRITING |
DRAWING |
- Did you respond directly to the question?
- Are your measurements exact?
|
- Do not use words like "it" unless you're sure the reader
knows what "it" refers to
- Specify units
|
- Use labels and arrows
- specify units or dimensions
|
| COMPLETE |
WRITING |
DRAWING |
- Did you respond to all parts of the question?
- Have you included all the parts normally expected
(e.g., of a graph)?
|
- Assume that the reader knows only what you tell him or
her
|
- Lable/identify all parts and pieces
|
Radiation Performance Assessment
EXPERIMENTAL DESIGN
Student Answer Sheet |
| Write your answers to the questions below in pencil.
Feel free to go back and change your responses within the time
allowed. Make sure all your answers are CLEAR, PRECISE, and
COMPLETE! |
You have been given the following problem:
Given a choice of buildings painted in one of three colors,
which color would do the best job of keeping the inside of the building
from heating up quickly under the hot sun?
The previous task gave you the opportunity to "mess around" with
some equipment. For this task you need to design an experiment that
uses the equipment on the Student Instruction Sheet to measure
the RATE OF HEATING for Color A, Color B, and Color C.
Your experiment should include at least one experimental trial
for each color.
- In your own words, what would you be trying to find out in such
an experiment? In other words, what would be the experiment's
purpose?
- List at least three measurements or quantities you would be
sure to keep the same for each trial in your experiment.
(These are factors that you need to control or standardize.)
Others:
- Think about how you would do a science experiment to investigate
this problem. In the space below, write a set of directions that
another student could follow to carry out your experiment. In
addition to the guidelines given on the first page of this answer
sheet, your directions should:
- begin with a list/illustrations of the materials
you will use
- be a series of numbered steps (after the materials
section)
- have enough detail so that another student would
know exactly what to do without extra help.
- include illustrations where you feel they are appropriate
MATERIALS:
Continue your answer to Question 3 in the space below as needed.
Otherwise, GO ON TO QUESTION 4 ON THE NEXT PAGE.
- Draw a chart or table that you could use to record the data
from your experiment. Make sure this chart or table allows you
to organize the data so that you could compare the three different
colors to one another.
- In what units does your experiment measure rate of heating?
__________ per ___________
Radiation Performance Assessment
RADIATION EXPERIMENT
Group Activity Card |
The Sunshine Construction Company has asked you, as skilled science
students, for information on the following problem:
Given a choice of buildings painted in one of three different
colors, which color would do the best job of keeping the inside
of the building from heating up quickly under the hot sun?
To investigate this problem, your group will be able to use the
following materials:
| Your group should have the following materials: |
Your teacher will supply the entire class with the
following materials: |
- Student Data Sheets
(1 for each group member)
- 1 Celsius thermometer
- 1 watch with second hand or stopwatch
- 1 250- ml beaker
- 1 400- ml beaker
- 1 100-ml graduated cylinder
- 3 test tubes, each a different color
- 1 test tube rack
- 1 support stand and rod (ring stand)
- 1 reflector lamp
- 1 150- watt light bulb
- 1 metric ruler
- 3 or more textbooks (to make platform for raising test
tube rack)
|
- water supply from faucet or container labeled "tap Water."
- safety goggles for every student
- paper towels (or other drying material)
|
Read through all of the instructions BEFORE beginning this
experiment!
Complete the following steps when directed to do so by your instructor:
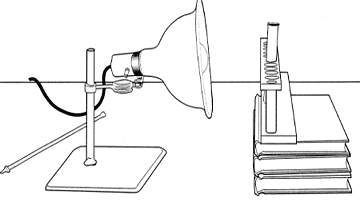
- Without any water, arrange the reflector Lamp (containing
a 150 watt light bulb), support stand and rod, test tube rack
with any single test tube, and textbooks as shown in Figure 1.
Use textbooks to make sure that the middle of the test
tube is at the same height as the center of the light bulb.
So that they are not affected by the light from the bulb, keep
the test tubes and the thermometer behind the lamp when
not in use. Plug in the lamp, turn it on and off to make sure
it works. Be careful not to shine the light in anyone's eyes and
do not look directly into the bulb.
Leave the lamp turned off for now.
CAUTION:
Avoid touching the Reflector Lamp and the light
bulb - they can get very hot!!! Also, if water hits
the surface of the heated light bulb it may explode.
KEEP WATER AWAY FROM THE LAMP
AND WEAR SAFETY GOGGLES AT ALL TIMES!!!
|


TRIAL 1
- Place the yellow test tube in the center of the test
tube rack (there should be no other test tubes in the rack). Measure
20 ml of room temperature water into this test tube.
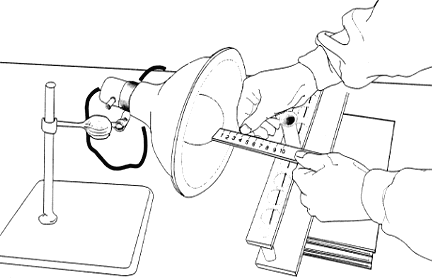
- With the Reflector Lamp off, move the test tube
rack so that there is a distance of 10 cm between the outside
edge of the test tube and the outside edge of the round part of
the light bulb (see Figure 2).
- Place the thermometer in this test tube and record the temperature
of the water in the appropriate space of your Task 2A.4 Student
Data Sheet.
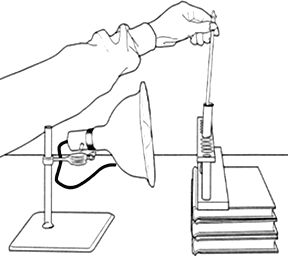
- Turn the Reflector Lamp on and begin timing. Reaching
from behind or to the side of the Reflector Lamp (see Figure 3),
read the temperature every 30 seconds and record this information
in the appropriate spaces.
- Turn the Reflector Lamp off. Empty the water from
the test tube and place it upside down at either end of the test
tube rack.
- Calculate the total change in temperature and record this number
in the appropriate space.
TRIAL 2
- Place the blue test tube in the center of the test tube
rack. Measure 20 ml of room temperature water into this test tube.
- With the Reflector Lamp off, check to make sure
that the distance between the outside edge of the test tube and
the outside edge of the round part of the light bulb is still
10 cm (see Figure 2). Reposition the test tube rack if necessary.
- Place the thermometer in this test tube and record the temperature
of the water in the appropriate space of your Task 2A.4 Student
Data Sheet.
- Repeat steps 5-7 as in Trial 1.
TRIAL 3
- Place the gray test tube in the center of the test tube
rack. Measure 20 ml of room temperature water into this test tube.
- With the Reflector Lamp off, check to make sure
that the distance between the outside edge of the test tube and
the outside edge of the round part of the light bulb is still
10 cm (see Figure 2). Reposition the test tube rack if necessary.
- Place the thermometer in this test tube and record the temperature
of the water in the appropriate space of your Task 2A.4 Student
Data Sheet.
- Repeat steps 5-7 as in Trial 1.
| When the time is up, turn in this sheet and your Student
Data Sheet and clean and return your equipment as directed
by your instructor. |
Radiation Performance Assessment
Student Data Sheet |
Table 1. Heating Trial Temperatures
TIME
(in seconds) |
TRIAL 1
Yellow (in š C) |
TRIAL 2
Blue (in š C) |
TRIAL 1
Gray (in š C) |
| 0 (starting) |
|
|
|
| 30 |
|
|
|
| 60 |
|
|
|
| 90 |
|
|
|
| 120 |
|
|
|
| 150 |
|
|
|
| 180 |
|
|
|
| 210 |
|
|
|
| 240 |
|
|
|
| 270 |
|
|
|
| 300 |
|
|
|
Table 2. Summary
|
TRIAL 1
Yellow (in š C) |
TRIAL 2
Blue (in š C) |
TRIAL 1
Gray (in š C) |
| Total change in temperature (š C) |
|
|
|
| Rate of heating (š C per minute) |
|
|
|
Radiation Performance Assessment
EXPERIMENTAL ANALYSIS
Student Data Sheet |
Note: The results on this Sample Data Sheet are from an
experiment similar to the one you performed, except that measurements
were taken every 60 seconds instead of every 30 seconds.
Table 1. Heating Trial Temperatures
TIME
(in seconds) |
TRIAL 1
Yellow
water volume
V=20 ml |
TRIAL 2
Blue
water volume
V=20 ml |
TRIAL 3
Gray
water volume
V=20 ml |
TRIAL 4
Red
water volume
V=20 ml |
TRIAL 5
Red
water volume
V=20 ml |
TRIAL 6
Red
water volume
V=20 ml |
| 0 (starting) |
š C |
š C |
š C |
š C |
š C |
š C |
| 60 |
š C |
š C |
š C |
š C |
š C |
š C |
| 120 |
š C |
š C |
š C |
š C |
š C |
š C |
| 180 |
š C |
š C |
š C |
š C |
š C |
š C |
| 240 |
š C |
š C |
š C |
š C |
š C |
š C |
| 300 |
š C |
š C |
š C |
š C |
š C |
š C |
Table 2. Total Change in Temperatures
TRIAL 1
Yellow |
TRIAL 2
Blue |
TRIAL 3
Gray |
TRIAL 4
Red |
TRIAL 5
Red |
TRIAL 6
Red |
| š C |
š C |
š C |
š C |
š C |
š C |
Radiation Performance Assessment
EXPERIMENTAL ANALYSIS
Student Data Sheet |
Read through this table carefully, and use it to help you write
answers that are CLEAR, PRECISE, and COMPLETE.
| GUIDING QUESTION(S) |
CAUTIONS |
| CLEAR |
WRITING |
DRAWING |
- Can another student understand what you've written or
drawn?
|
- Answer in complete sentences when appropriate
|
- Avoid crowding
- Erase completely
|
| PRECISE |
WRITING |
DRAWING |
- Did you respond directly to the question?
- Are your measurements exact?
|
- Do not use words like "it" unless you're sure the reader
knows what "it" refers to
- Specify units
|
- Use labels and arrows
- specify units or dimensions
|
| COMPLETE |
WRITING |
DRAWING |
- Did you respond to all parts of the question?
- Have you included all the parts normally expected
(e.g., of a graph)?
|
- Assume that the reader knows only what you tell him or
her
|
- Lable/identify all parts and pieces
|
Radiation Performance Assessment
EXPERIMENTAL ANALYSIS
Student Answer Sheet |
Before starting, make sure you have the following materials: 1
Sample Data Sheet, 1 ruler, 1 ordinary pencil, and 1 set
of colored pencils (minimum 3).
- Graph the results of Trials 1, 2, and 3 only as
given on the Sample Data Sheet. Create a line graph
on the grid below. Your graph should display data from these three
trials on a single set of axes. Data from each trial should
be displayed in a different color. YOU WILL BE GIVEN 15 MINUTES
TO COMPLETE YOUR GRAPH. (If you finish your graph sooner,
go on to the next question.)
Title:

- Looking at your graph, describe how the rate of heating
changed during each trial. Remember that your answers should be
clear, precise, and complete.
- Trial 1:
- Trial 2:
- Trial 3:
- Temperature is measured in š C. Heat is measured in calories.
One calorie is the energy gained or lost by 1 ml of liquid water
when its temperature rises or falls by 1 š C. For example,
if 2 ml of water rose 3 š C in temperature ( T=3 š
C), then 6 calories would be gained. If 5 ml of water fell 2 š
C ( T=-2 š C), then 10 calories would be lost. In
the box below, write a formula for heat energy gained in calories.
| If Q is the heat energy gained in calories, and
T is the total change in temperature in š
C
(see Table 2 on your Sample Data Sheet for an example
of T), and
V is the volume in ml, then
Q = ______________________
(complete the equation using T and V)
|
Using this formula, calculate the heat gained by the
water in the test tube for each of the 6 trials. Be sure to
calculate the total heat gained during the five minutes
when measurements were taken for each trial.
Complete the following table as you do your calorie calculations:
Table 3. Heat Gain Calculations
| Trial |
Color |
V |
T |
Q |
| 1 |
Yellow |
|
|
|
| 2 |
Blue |
|
|
|
| 3 |
Gray |
|
|
|
| 4 |
Red |
|
|
|
| 5 |
Red |
|
|
|
| 6 |
Red |
|
|
|
-
- Which of the six trials showed the greatest total change
in temperature?
- What was the amount of that temperature change?
-
- Which of the six trials showed the greatest heat gain?
- What was the amount of that heat gain?
- What is a possible reason why different temperature changes
were observed in Trials 4 and 6?
-
- Name two trials that you could compare to investigate the
effect of volume of water in the test tube on the rate
of heating.
____________________ and ____________________
- Why did you choose those two trials?
- From the sample data, what can you conclude about the effect
of volume on rate of heating? Remember that your answer should
be clear, precise, and complete.
-
- Now answer this question:
Given a choice of buildings painted in one of three
different colors, which color would do the best job of keeping
the inside of the building cool under the hot sun - yellow,
blue, or gray?
- What evidence is there that this color would be the best
at keeping the inside of the building cool? Be specific. Consider
information on the Sample Data Sheet, your graph, and
the tables on this Answer Sheet. You may use graphs
or illustrations as part of your answer. Remember that your
answers should be clear, precise, and complete.
|


