Contributed by: The RAND Institute (RAND)
Directions
You are going to be doing three investigations associated with
the ice-making plant and the Lake Wilmar area. They are:
- Investigation 1- Decline in Freshwater Animal Populations
- Investigation 2- Hot Rocks and Water
- Investigation 3- Rock Erosion
To complete these investigations, you will need to do the following:
- Take this answer booklet with you as you go to each station.
- Make careful observations.
- Carefully record, organize, and graph your data and observations.
- Analyze your data clearly using your observations for support.
- Clean up the station when you are finished and leave the materials
as you found them.
Time is limited. Work quickly and carefully. There is not enough
time to repeat the experiments.
Before going to the first investigation, you need to start the
following to save time later:
- Use the balance to determine the mass of the rock on your placemat.
Mass of rock:
The Captain and Lake Wilmar

What's happening in Lake Wilmar?
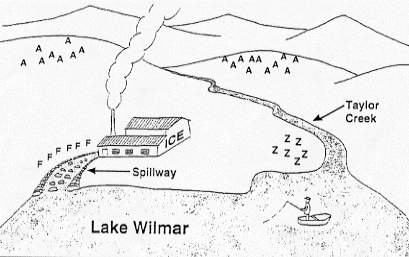
Old Captain McDermit has been fishing at Lake Wilmar for the past
25 years. Ten years ago, an ice-making plant was built on the shore
of the lake. Since then, Captain McDermit has noticed that the population
of animals living by and in the lake has been decreasing.
However, Captain McDermit has noticed that the population of animals
living by and in the lake has been decreasing.
The ice-making plant was built at this site for two reasons:
- The weather was cooler than at an alternate site ten miles away
from the lake, on the other side of the mountain.
- The lake supplied the water needed in ice making.
An effort was made to ensure that the wastewater from the plant
did not harm the plants and animals in the lake. A long spillway,
made of the native limestone rock, was constructed to add oxygen
to the water for the benefit of the wildlife.
Investigation 1- Decline in Freshwater Animal Populations
Directions:
Your task is to determine and then compare the pH of samples of
water from Lake Wilmar, wastewater from the ice-making plant, and
water from Taylor Creek, which flows into the lake. The pH scale
measures the strength of an acid or base.
The pH Scale

- Use pH paper to determine the pH of the water from Lake Wilmar.
- Use pH paper to determine the pH of wastewater from the ice-making
plant.
- Use pH paper to determine the pH of water from Taylor Creek.
- Briefly record your observations.
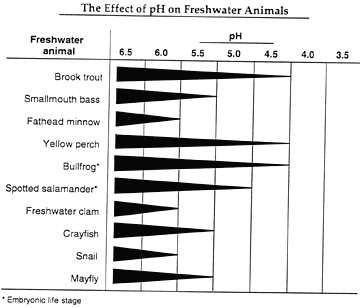
| The information on the chart below was prepared by a wildlife
organization. It records the effect of pH on freshwater
animals. The thickness of the line indicates the ability
of the species to survive at different pH values. (The thicker
the line, the higher the survival rate for that species.) |
The Effect of pH on Freshwater Animals

- The population of brook trout in Lake Wilmar has declined significantly
since the ice-making plant was built. Explain what might
have caused the change in the brook trout population.
- If you were a ranger, explain in detail what additional experiments
you would conduct to verify the information on the chart from
the wildlife organization on page 4.
- Explain how the information from the wildlife organization's
chart and the results of your pH tests could explain the problem
Captain McDermit has observed in Lake Wilmar.
Investigation 2- Hot Rocks and Water
Directions:
- Tie a string on the rock and place it in the hot water bath
at your station for at least 7 minutes. You will be using
both the rock and the hot water in this investigation.

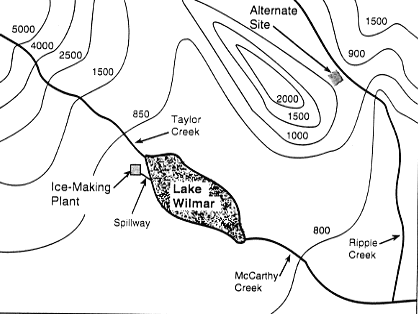
| The topographical map of the Lake Wilmar area shows the
ice-making plant and the alternate site on the other side
of the mountain. |
Map of the Lake Wilmar Area

To investigate why the weather at the lake was cooler than
an alternate site 10 miles away from the lake on the other side
of the mountain, you will complete the following tasks:
- Determine the amount of heat that can be stored in a rock.
- Determine the amount of heat that can be stored in equal
masses of water if they are at the same temperature.
- Compare those amounts.
Part A - Water and Rock
- Pour 100 ml of tap water into a Styrofoam cup.
- Measure the temperature of the tap water in the cup. Record
it to the right of the zero on the data chart.
- Remove the rock from the hot water bath and place it in
the Styrofoam cup containing the tap water.
- Measure the temperature of the water in the cup every 30
seconds for 2 minutes. Record your measurements on the data
chart.
| Time (sec) |
Temperature of Water and Rock (Part A) |
| 0 |
|
| 30 |
|
| 60 |
|
| 90 |
|
| 120 |
|
Part B - Water and Water
- Take another Styrofoam cup and pour 100 ml of new tap water
into it.
- Measure the temperature of the water in the new cup. Record
it to the right of the zero on the data chart.
- Record the mass of the rock in the space provided below.
(You determined this value at the beginning of the activity.)
- Measure the same number of milliliters of hot water as you
recorded for the mass of the rock. (For example, if the mass
of the rock is 45 grams, then measure 45 milliliters of hot
water from the hot water bath.) Pour the hot water into the
cup of tap water. Record the mass of the water in the space
provided below.
The density of water is 1 gram per milliliter.
1g = 1 ml
|
Mass of Rock
Mass of Water
- Measure the temperature of the water in the cup every 30
seconds for 2 minutes. Record your measurements on the data
chart.
| Time (sec) |
Temperature of Water and Water (Part B) |
| 0 |
|
| 30 |
|
| 60 |
|
| 90 |
|
| 120 |
|
- Use the information from your data charts to make a graph representing
time and temperature for each of the trials.
Time and Temperature Graph

- Think about the procedure you have just completed as you answer
this question. One milliliter of water has a mass of 1 gram. This
means that the mass of the rock and the mass of the hot water
you used in this activity were equal. With this in mind, which
would hold the most heat energy; 50 grams of rock at 60 degrees
Celsius or 50 grams of water at 60 degrees Celsius?
- Lake Wilmar has fewer temperature changes during the year than
the alternate inland site (see topographical map at the beginning
of this task). Explain why this happens.
Investigation 3- Rock Erosion
Directions:
You will complete the following tasks:
- Determine the effects of tap water on limestone rock.
- Determine the effects of wastewater from the ice-making plant
on limestone rock.
- Compare your results.
Complete the following activities:
- Place a sample of limestone rock in a clear plastic cup.
- Slowly pour enough spillway wastewater into the cup to cover
the rock.
- Place another sample of limestone rock in the other clear plastic
cup and cover it with fresh water.
- Observe what happens in the cups for about 3 minutes.
Briefly record your observations.
What happened when the limestone rock was covered with the spillway
wastewater in the beaker? Describe a procedure you would use to
verify your reasoning.
Would you expect the limestone rocks to react in the same way
in Taylor Creek water as they did in the spillway wastewater? Explain
why or why not.
After several years the surface of a marble statue in the front
parking lot of the ice-making plant was worn away and covered with
small holes. Explain what could have caused this wearing
away.
|


