|
 |
|
|
|
|
Grade 5-8 Performance Task Task:In this activity, you will interpret a graph of ocean depths and topographic features. Materials:
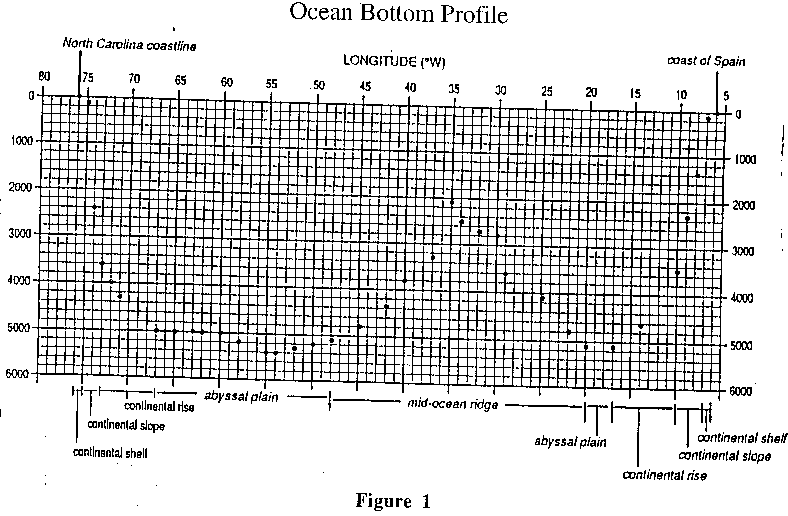
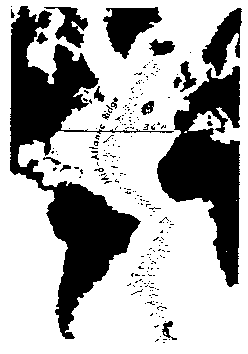
Background:The data for the graph is figure 1 (see attached) was obtained by a ship that sailed between North Carolina and Spain along approximately 36 degrees N latitude. Thirty-six stops were made to collect data. Figure 1 shows the seafloor depth at each location and identifies the seafloor region. The map below shows the 36 degrees N latitude line across the Atlantic Ocean. This is the approximate path traveled by the ship from North Carolina to Spain.
To make the profile easier to plot, the vertical scale is not the same as the horizontal scale. The amount by which the vertical scale is greater than the horizontal scale is called the vertical exaggeration (VE). The value for VE is found by dividing the horizontal scale by the vertical scale. Note, both scaled must be in the same units. VE = horizontal scale To answer the questions, remove the Ocean Bottom Profile (fig. 1) from your task packet and draw a line to represent the ocean bottom according to the plotted data.
Answer Sheet
|
 At 36
degrees N, the horizontal distance represented by each degree of
longitude is 90 kilometers.
At 36
degrees N, the horizontal distance represented by each degree of
longitude is 90 kilometers.| a. Which seafloor region is widest? | _________________________ |
| b. Which is narrowest? | _________________________ |
2.
a. What is the ocean depth at 15 degrees W? ________________________ b. What is the depth of the edge of the continental shelf? ________________________
3. Look at Figure 1. Note the seafloor regions listed in the first column and the 1 degree longitude ranges in the in the second column. Locate these same longitudes in Figure 1. Determine the change in depth that occurs between each pair of longitudes and record the value in the third column.
|
Seafloor Region
|
Longitude Range (degrees W)
|
Depth Change (m)
|
|
Continental Slope
|
74-73
|
|
|
Continental Rise
|
72-71
|
|
|
Abyssal Plain
|
63-62
|
a. Which seafloor region is steepest? ____________________ b. Which seafloor region is most level? ____________________
4. Determine the vertical exaggeration (VE) of Figure 1. (Hint: Determine the number of meters in one horizontal square and the number of meters in one vertical square. Remember that 1 kilometer = 1000 meters.) For full credit, you must either explain your reasoning or show your work.
Vertical Exaggeration:
5. Using complete sentences, compare the profile in Figure 1 to the appearance of a true scale profile of these ocean depths.
6. The bedrock of the ocean floor is youngest at the mid-ocean ranges and is older as distance increases away from the ridges. Using one or more complete sentences and based on your knowledge of plate tectonics answer the following questions:
a. What crustal movement is most likely occurring beneath the mid-ocean ridge? (You may use a diagram with arrows to aid in your answer.)
b. The mid-ocean ridges are primarily composed of what kind of bedrock?
c. Using complete sentences, explain why hot water vents are often found in the rift valleys at the mid-ocean ridges?
Figure 1: