|
Grade
3-4 Performance Task
GLOBE Assessment
Earth
Systems Investigation Tests

A group of crop
scientists is studying if they can grow a food crop from one
area in a different part of the world. The place where the
crop grows now, is called the "native area". To begin their
studies, the scientists are looking for areas that have similar
growing seasons. The growing season is the time period from
the plant is actively growing. The environment and climate
conditions must be just right. "Green-up" is the time when
plants begin to grow. "Brown-down" is the time when plants
stop growing for the season. To begin their studies on the
growing season in different areas, scientists are looking
at air temperature and soil moisture.
In this activity
you will compare the growing season in several areas.
1) (Plan Investigations:
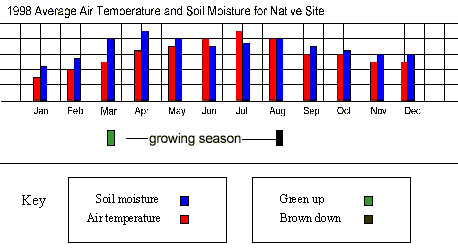
Pose relevant questions) Use information from the graph
on page 1 to help you fill in the table below:
|
How
is this native area
LIKE
the area where you live?
|
How
is this native area
UN-LIKE
the area where you live?
|
|
|
|
2) (Interpret
GLOBE Data: Infer patterns, trends) Before you can look
for areas with similar growing seasons, you need to study
the growing season in the native area more. Look at the graph
on page 1. Mark the beginning of each season on the graph.
Write S for Spring, Su for Summer, F for Fall and W for Winter.
What clues did you use to help you decide when each season
begins?
The crop scientists
have found three other areas they would like to study more.
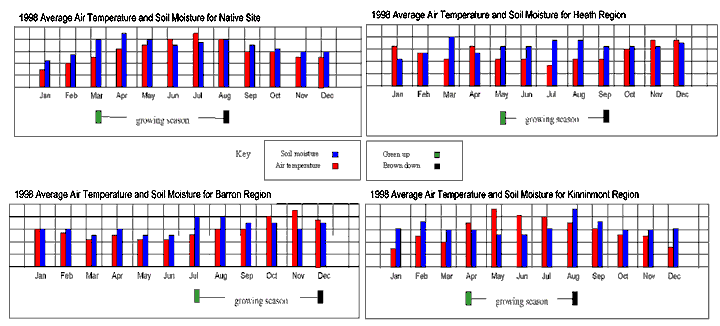
The growing season graphs for all of the study areas are shown
below.

3) (Interpret
GLOBE Data: Infer patterns, trends) Look at the bar graphs
on page 3. Copy the season information from page 1 onto the
native site graph on page 3. Then mark where you think each
season begins for Heath Region, Barron Region and Kinnimont
Regions.
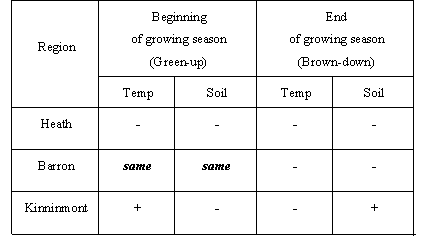
4) (Interpret
GLOBE Data: Explain data and relationships) Use the information
in the graphs on page 3 to collect more information about
the regions. You will compare the new regions to the native
site. Write "+" if the measurement at the new site is more
than the measurement at the native site. Write "-" if the
measurement is less than the measurement at the native site.

5) (Analyze
GLOBE Data: Identify similarities and differences) Use
the information in the table you just made to help you decide
which of the new sites is MOST like the native site? What
information helped you decide?
6) Plan Investigations:
Specify measurements to investigate) The graphs on page
3 all show how "green-up" and "brown-down" are related to
the temperature and soil moisture. Think about and write down
two other factors might affect when "green-up" and "brown-down"
occur.
7) (Communicate:
Compose reports to explain or persuade) Write a one-page
letter to the crop scientists. Include these 3 things in your
letter:
A. Use your own
words to write a summary of how you analyzed the information
in the graphs that they gave you. Be sure to include your
conclusions also.
B. Tell the scientists
what new graphs do you suggest they get from the GLOBE databank
that will help them make more comparisons of these study sites.
Explain why you think each graph will give helpful comparisons.
C. One question
you would like to ask the crop scientists about this study
and why you are interested in the answer.
|

