 |
 |
|
|
|
|
GLOBE
Assessment (Given data from the GLOBE data archives)
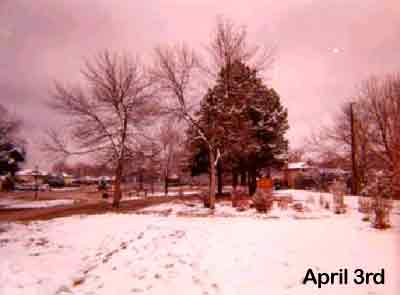
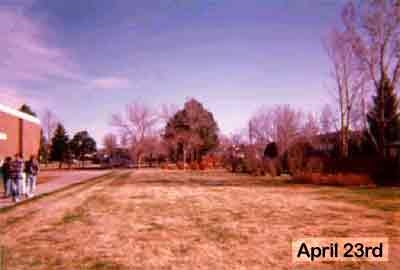
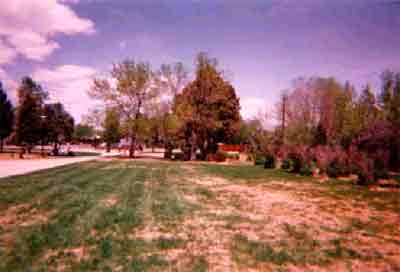
(Present problem requiring use of GLOBE data archives) The students in your classroom are GLOBEpals with students at another school. You like to print out the pictures and data measurements taken from your GLOBEpal school. It helps you imagine what is happening at their school so that you can write more interesting notes to them. In this activity you will look at some pictures and data measurements made by your GLOBEpals. 1) (Take GLOBE Measurements: Make cloud observations that are accurate and appropriate) Look at the 3 pictures taken from your GLOBEpal school. Tell what type of clouds you see in each picture and estimate the amount of cloud cover on each of the days.
2) (Interpret GLOBE data: Infer patterns / trends; Explain the relationship between cloud type and precipitation) Look again at the type of clouds in each picture. Do you think that any of these clouds produced rain or snow later in the day? How can you tell?
3) (Interpret GLOBE Data: Infer patterns & trends) Your GLOBEpals sent a picture of their school site every three weeks. Can you predict the cloud type and cloud cover for June 4th, three weeks from when the last photo was taken? Tell how you made your prediction or tell why you cannot make a prediction.
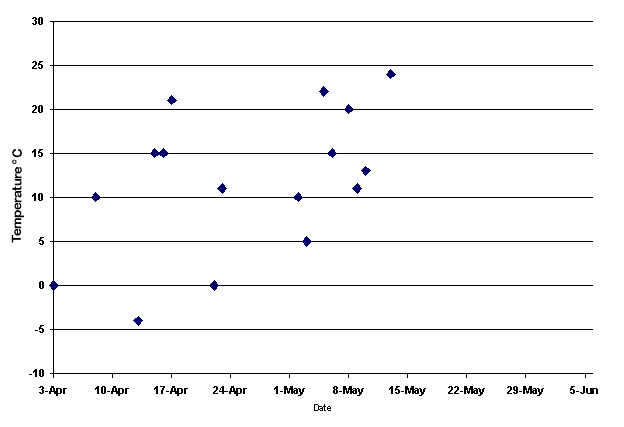
4) (Interpret GLOBE Data: Infer patterns & trends) Table 1 shows the air temperatures from your GLOBEpal school site during the time period when the pictures were taken. The current temperatures from this table are plotted on Graph 1. Look carefully at the graph. It is difficult to find a pattern that tells you how the air temperature changed during this time. Write a GLOBEmail to your GLOBEpals and suggest 2 ways to change their GLOBE data collection so that the data would be more useful. Table 1: Air Temperature Information
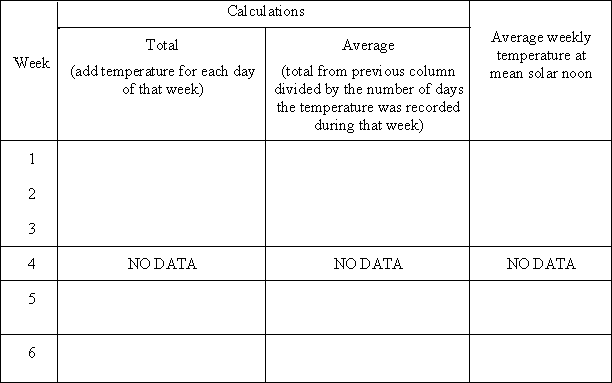
5) (Interpret GLOBE Data: Create multiple formats to represent data) Sometimes it is easier to find a pattern when you look at the data in a different way. In this next activity you will see what happens when you draw a graph that shows how the average temperature changed each week between April 3rd and May 14th. First draw a box around the days in the data table that stand for week 1, week 2 etc. (HINT: all data is missing from week four.) Next find the average temperature for each of these weeks. Record the information in the data table below. The calculations for the first week has been done for you.
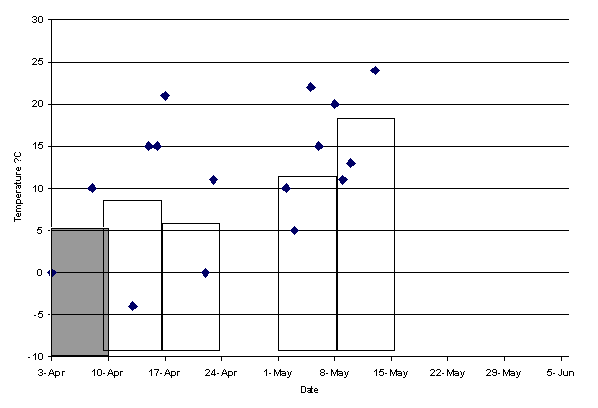
6) (Interpret GLOBE Data: Create multiple formats to represent data) Use the data in Table 2 to make a bar graph of the average weekly temperature on the graph below. Data from the first week has been graphed to show you what to do. Figure 2: Air Temperatures & Weekly Averages for April 3 to May 14
7) (Interpret GLOBE Data: Explain data & relationships) Look at the bar graph that you just completed. Tell what is happening to the temperature from April 3rd until May 14th.
8) (Interpret GLOBE Data: Explain data & relationships) Predict the air temperature at this school on June 4th, three weeks from when the last photo was taken. Tell how you made the prediction.
9) (Communicate: Compose reports to explain or persuade) Write a GLOBEmail to your GLOBEpals. Tell them about your air temperature predictions and how you made them. Ask them to write back and tell you about the temperatures that they measured on June 4th.
|
