|
Contributed by: Kentucky Department of Education (KDE)
Student Name: _______________________________________________
School Name: _______________________________________________
School Code: _________
GENERAL INSTRUCTIONS:
Write your name, school name, and school code on the line above.
Do not open this packet until the directions tell you to do so.
You will have a total of 45 minutes to complete this task. You
may use up to 20 minutes to complete the group work, found on the
front and back pages of this form. When your group is finished with
the group work, one member of the group should tell the facilitator
that you have finished. Then go on to the individual work. You may
not talk while you are working on those pages.
Your group should have the following materials:
- four Data Sheets
- one 100 watt light source
- one ring stand
- three styrofoam cups with colored plastic covers
- three thermometers inserted in the cups
- one stopwatch
- four sets of colored pencils
- four rulers
GROUP ACTIVITY:
The purpose of this activity is to use data from an experiment
to draw conclusions about how a product will work.
Your group is in charge of designing a new product for use in
motor vehicles. The purpose of the product is to filter sunlight
coming into the vehicle. This product will stick to the inside of
the vehicle's windows and may be removed when not needed. The temperature
inside of the car will be affected as light filters through the
product. Keeping this information in mind, your group must analyze
the colors available for this product using the materials provided.
PROCEDURE
Important: Read all of the direcitons below before beginning
this task. Make sure every member of the group understands what
he/she is supposed to do.
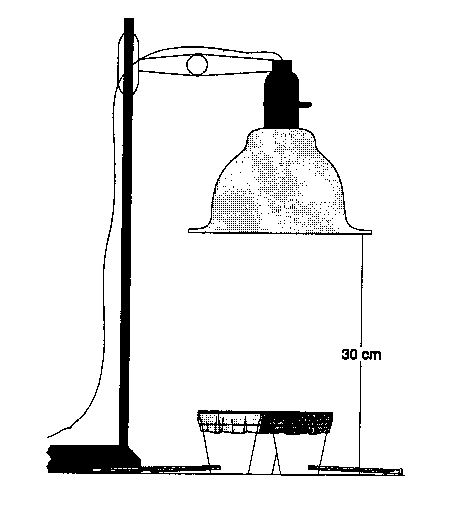
- Set up your equipment as shown in the diagram above. All three
cups should be directly below the light source. Do not turn the
light on yet.
- Assign one student to be the timer and give that student
the stopwatch.
- The other three students will act as the observers. Each
observer must select a specific color cup and monitor the temperature
of that cup.
- Observers: record the temperature of your own cup on
your data sheet before beginning the experiment.
- Timer: now turn the light on and start the stopwatch
at the same time. Leave the light on for four minutes.
- Timer: announce the time every 30 seconds for a total
of four minutes.
- Observers: At each 30-second announcement, record the
temperature from your colored cup's thermometer on your data sheet.
- TIMER: AFTER FOUR MINUTES, TURN THE LIGHT OFF, BUT LEAVE
THE STOPWATCH RUNNING.
- Timer: continue announcing the time every 30 seconds
for another four minutes.
- Observers: continue recording the temperature of your
own cup as each time is announced.
- After eight minutes of observations are recorded, each observer
will have completed one column on a data sheet for one of the
colored cups. Now, all members of the group (timer and
all observers): record all the data from all three observes
on your own data sheets. Be sure each member of the group records
all of the data collected.
When you are finished with the work on this page, one member
of the group should tell the facilitator that your group has
finished its group work. Then do the individual work. You may
not discuss the questions or share information.
Student Name: _________________________________________________
School Name: __________________________________________________
School Code: _________
Important: all members of the group must record all data
before the end of the group work.
|
TIME Minutes:seconds
|
Red cup temperature
|
Yellow cup temperature
|
Violet cup temperature
|
|
0
|
|
|
|
|
:30
|
|
|
|
|
1:00
|
|
|
|
|
1:30
|
|
|
|
|
2:00
|
|
|
|
|
2:30
|
|
|
|
|
3:00
|
|
|
|
|
3:30
|
|
|
|
|
4:00
|
|
|
|
|
4:30
|
|
|
|
|
5:00
|
|
|
|
|
5:30
|
|
|
|
|
6:00
|
|
|
|
|
6:30
|
|
|
|
|
7:00
|
|
|
|
|
7:30
|
|
|
|
|
8:00
|
|
|
|
INDIVIDUAL ACTIVITY
- Construct a line graph that displays all of the data on
your data sheet.

- Analyze the temperature changes for each color recorded
on the graph above. Explain how the pattern observed with
each color differs from the patterns of the other colors.
__________________________________________________________________________
__________________________________________________________________________
__________________________________________________________________________
__________________________________________________________________________
__________________________________________________________________________
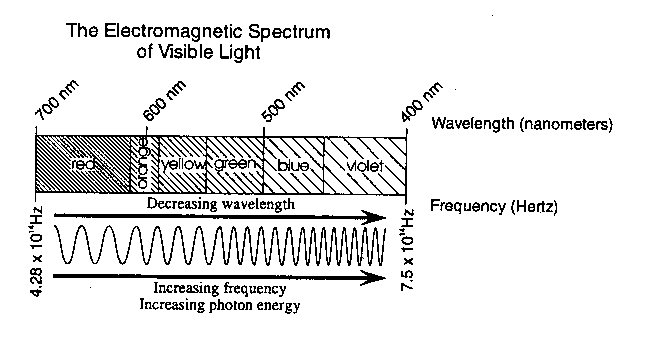
- Using your graph and the diagram of the electromagnetic
spectrum of visible light (above), explain the probable causes
of the temperature differences among the three filter colors.
__________________________________________________________________________
__________________________________________________________________________
__________________________________________________________________________
__________________________________________________________________________
__________________________________________________________________________
- Based on the results of your investigations, which color(s)
would you recommend be used for a product that filters the
sunlight coming into vehicles in Kentucky? Use as much detail
as possible to justify your recommendation(s).
__________________________________________________________________________
__________________________________________________________________________
__________________________________________________________________________
__________________________________________________________________________
__________________________________________________________________________
Kentucky Department of Education
Performance Events 1994-95
|