9th Grade Performance Task
Developed by: RAND Corporation (RAND)
Stanford University and the Far West Laboratory, 1994
|
Rate of Cooling Performance Assessment
RATE OF COOLING EXPERIMENT
Group Activity Card
|
The Alpine Outdoor Clothing Company has asked you,
as skilled science students, for information on the following
problem:
Given a choice of jackets made from three different
materials, which one would do the best job of slowing down the
loss of body heat?
| Your group should have the following materials: |
Your teacher will supply the entire class with the
following materials: |
- Student Data
- 1 Celsius thermometer
- 1 watch with second hand or stopwatch
- 1 250-ml beaker
- 1 large plastic container with lid, containing:
- 1 standard soup size metal can with top lid removed
- 1 fabric "sock," labeled Fabric B
- 1 sandwich size re-sealable plastic bag
- 2 rubber bands
|
- water supply labeled "Warm Water"
- water supply from faucet or labeled "Tap Water"
- ice (cubes or crushed)
- safety goggles for every student
- paper towels (or other drying material)
|
Read through all of the instructions BEFORE
beginning this experiment!
Complete the following steps when directed to do
so by your instructor.
TRIAL 1
-
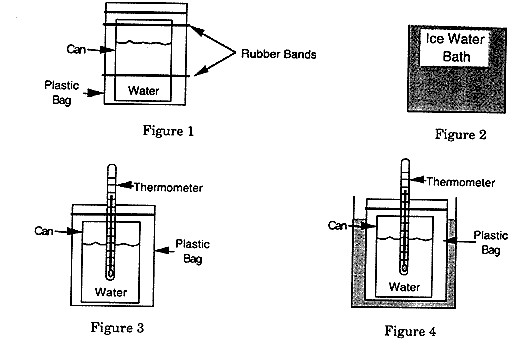
Wrap the empty can in Fabric A, place
it in the plastic bag (with the opened end facing up), and
put the two rubber bands around the bag to hold it in place.
Make the bag fit tightly, so there is no air space between
the bag and the can (see Figure 1 on page 2).
-
Add roughly equal amounts of ice and water
from a faucet ("Tap Water") to the large plastic
container so that it is nearly full (see Figure 2 on page
2).

-
Place 200 ml of "Warm" water into
the can wrapped in Fabric A.
-
Place the thermometer in the can and seal
the top of the bag around it (see Figure 3 above).
-
Place the setup shown in Figure 3 into your
ice water bath (see Figure 4 above). Be careful not to let
any of the water from the ice water bath get inside the plastic
bag.
-
Check the temperature of the warm water. When
it is 37 degrees Celsius (between 35 degrees and 39 degrees
is acceptable), record this as your starting temperature on
your Student Data Sheet.
-
Read the temperature every 30 seconds for
five minutes (300 seconds) and record this information on
your Student Data Sheet as you go.
-
Calculate the total change in temperature
and the rate of cooling and record these numbers in the appropriate
spaces on your Student Data Sheet.
-
Remove the setup from the ice water bath.
Remove the thermometer, water, and fabric "sock"
from the can. If necessary, dry the inside of the plastic
bag.
TRIAL 2
-
Repeat step 1 using Fabric B.
-
Place 200 ml of "Warm" water into
the can now wrapped in Fabric B.
-
Place the thermometer in the can and seal
the top of the bag around it (see Figure 3 on page 2).
-
Place the setup shown in Figure 3 into your
ice water bath (see Figure 4 on page 2). Be careful not to
let any of the water from the cold water bath get inside the
plastic bag.
-
Watch the temperature, and try to begin timing
just when the temperature reaches 37 degrees Celsius (between
35 degrees and 39 degrees is acceptable). Record the starting
temperature in the appropriate space on your Student Data
Sheet.
-
Repeat steps 7 through 9 as done in Trial
1.
TRIAL 3
-
Repeat step 1 using Fabric C.
-
Place 200 ml of "Warm" water into
the can now wrapped in Fabric C.
-
Place the thermometer in the can and seal
the top of the bag around it (see Figure 3 on page 2).
-
Place the setup shown in Figure 3 into your
ice water bath (see Figure 4 on page 2). Be careful not to
let any of the water from the ice water bath get inside the
plastic bag.
-
Watch the temperature, and try to begin timing
just when the temperature reaches 37 degrees Celsius (between
35 degrees and 39 degrees is acceptable). Record the starting
temperature in the appropriate space on your Student Data
Sheet.
-
Repeat steps 7 through 9 as done in Trial
1.
|
When the time is up, turn in this sheet
and your Student Data Sheet, and clean and return
your equipment as directed by your instructor.
|
|
Rate of Cooling Performance Assessment
Student Data Sheet
|
Table 1. Cooling Trial Temperatures
|
TIME
(in seconds)
|
TRIAL 1
Fabric A
(in degrees Celsius)
|
TRIAL 2
Fabric B
(in degrees Celsius)
|
TRIAL 3
Fabric C
(in degrees Celsius)
|
|
0 (starting)
|
|
|
|
|
30
|
|
|
|
|
60
|
|
|
|
|
90
|
|
|
|
|
120
|
|
|
|
|
150
|
|
|
|
|
180
|
|
|
|
|
210
|
|
|
|
|
240
|
|
|
|
|
270
|
|
|
|
|
300
|
|
|
|
Table 2. Summary
| |
TRIAL 1
Fabric A
(in degrees Celsius)
|
TRIAL 2
Fabric B
(in degrees Celsius)
|
TRIAL 3
Fabric C
(in degrees Celsius)
|
| Total change in temperature (degrees Celsius) |
|
|
|
| Rate of Cooling (degrees Celsius per minute) |
|
|
|
|
Rate of Cooling Performance Assessment
EXPERIMENTAL ANALYSIS
Sample Data Sheet
|
Note: The results on this Sample Data Sheet
are from an experiment similar to the one you performed, except
that measurements were taken every 60 seconds instead of every
30 seconds.
Table 1. Cooling Trial Temperatures
|
TIME
(in seconds)
|
TRIAL 1
Fabric A
water volume
V=200 ml
|
TRIAL 2
Fabric B
water volume
V=200 ml
|
TRIAL 3
Fabric C
water volume
V=200 ml
|
TRIAL 4
No Fabric
water volume
V=200 ml
|
TRIAL 5
No Fabric
water volume
V=50 ml
|
TRIAL 6
No Fabric
water volume
V=200 ml
|
| 0 (starting) |
C
|
C |
C |
C |
C |
C |
|
60
|
C
|
C |
C |
C |
C |
C |
|
120
|
C |
C |
C |
C |
C |
C |
|
180
|
C |
C |
C |
C |
C |
C |
|
240
|
C |
C |
C |
C |
C |
C |
|
300
|
C |
C |
C |
C |
C |
C |
Table 2. Total Change in Temperature
|
TRIAL 1
Fabric A
|
TRIAL 2
Fabric B
|
TRIAL 3
Fabric C
|
TRIAL 4
No Fabric
|
TRIAL 5
No Fabric
|
TRIAL 6
No Fabric
|
|
C
|
C |
C |
C |
C |
C |
|
Rate of Cooling Performance Assessment
EXPERIMENTAL ANALYSIS
Student Answer Sheet
|
TEAR OFF THIS PAGE
Read through this table carefully, and use it
to help you write answers that are CLEAR, PRECISE, and COMPLETE.
|
GUIDING QUESTIONS
|
CAUTIONS
|
CAUTIONS
|
|
CLEAR
|
WRITING
|
DRAWING
|
- Can another student understand what you've written or
drawn?
|
- Answer in complete sentences when appropriate
|
- Avoid crowding
- Erase completely
|
|
PRECISE
|
WRITING
|
DRAWING
|
- Did you respond directly to the question?
- Are your measurements exact?
|
- Do not use words like "it" unless you're sure
the reader knows what "it" refers to
- Specify units
|
- Use labels and arrows
- Specify units or dimensions
|
|
COMPLETE
|
WRITING
|
DRAWING
|
- Did you responsd to all parts of the question?
- Have you included all the parts normally expected
(e.g., of a graph)?
|
- Assume that the reader knows only what you tell him
or her
|
- Label/identify all parts and pieces
|
|
Rate of Cooling Performance Assessment
EXPERIMENTAL ANALYSIS
Student Answer Sheet
|
Before starting, make sure you have the following
materials: 1 Sample Data Sheet, 1 ruler, 1 ordinary pencil,
and 1 set of colored pencils (minimum 3).
-
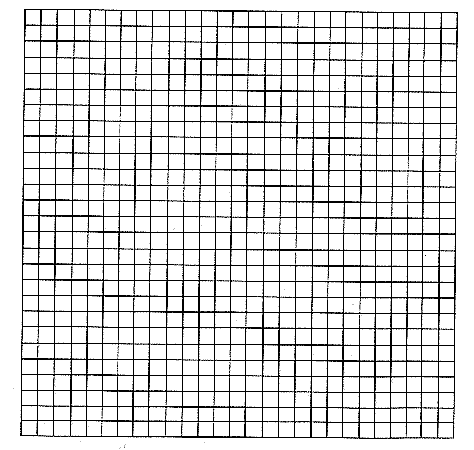
Graph the results of Trials 1, 2, and 3
only as given on the Sample Data Sheet.
Create a line graph on the grid below. Your graph should
display data from these three trials on a single set of
axes. Data from each trial should be displayed in a different
color. YOU WILL BE GIVEN 15 MINUTES TO COMPLETE YOUR GRAPH.
(If you finish your graph sooner, go on to the next question.)
Title: ________________________________________________________________

-
Looking at your graph, describe how the rate
of cooling changed during each trial. Remember that your
answers should be clear, precise, and complete.
a) Trial 1:
b) Trial 2:
c) Trial 3:
-
Temperature is measured in degrees Celsius.
Heat is measured in calories. One calorie is the energy
gained or lost by 1 ml of liquid water when its temperature
rises or falls by 1 degree Celsius. For example, if 2 ml of
water rose 3 degrees in temperature (delta T = 3 degrees),
then 6 calories would be gained. If 5 ml of water fell 2 degrees
(delta T = -2 degrees), then 10 calories would be lost. In
the box below, write a formula for heat energy lost in calories.
|
If Q is the heat energy lost in calories,
and
delta T is the total change in temperature in degrees
Celsius
(see Table 2 on your Sample Data Sheet for an example
of delta T),
and
V is the volume in ml, then
Q = ________________________
(complete the equation using delta T and V)
|
Using this formula, calculate the heat
lost by the water in the can for each of the 6 trials. Be
sure to calculate the total heat lost during the five
minutes when measurements were taken for each trial.
Complete the following table as you do your
calorie calculations:
Table 3: Heat loss calculations
|
Trial
|
Fabric
|
V
|
delta T
|
Q
|
|
1
|
A
|
|
|
|
| 2 |
B |
|
|
|
| 3 |
C |
|
|
|
| 4 |
None |
|
|
|
| 5 |
None |
|
|
|
| 6 |
None |
|
|
|
- a) Which of the six trials showed the greatest total change
in temperature?
b) What was the amount of that temperature change?
-
a) Which of the six trials showed the greatest
heat loss?
b) What was the amount of that heat loss?
-
What is a possible reason why different
temperature changes were observed in Trials 4 and 6?
-
a) Name two trials that you could compare
to investigate the effect of volume of water in the can
on the rate of cooling.
_____________ and ______________
b) Why did you choose those two trials?
-
From the sample data, what can you conclude
about the effect of volume on rate of cooling? Remember that
your answer should be clear, concise, and complete.
-
a) Now answer this question:
Given a choice of jackets made from three
different materials, which one would do the best job of slowing
down the loss of body heat - Fabric A, Fabric B, or Fabric
C?
___________________
b) What evidence is there that this fabric would
be the best at slowing down the loss of body heat? Be specific.
Consider information on the Sample Data Sheet, your
graph, and the tables on this Answer Sheet. You may
use graphs or illustrations as part of your answer. Remember
that your answer should be clear, concise, and complete.
|
|


