Grade 5-8 Performance Task
Contributed by: New York State Education Department
(NYSED)
NYS Alternative Assessment in Science Project (1996)
Task:
At this station, you will measure the rate of capillary
action in a peat pot.
Materials:
-
small peat pot
- small dish
- funnel
- metric ruler
- graduated cylinder
- stop watch
- water
- paper towels
|
 |
Background:
Peat is a surface deposit consisting of decayed plant materials.
It forms a very spongy soil, displaying obvious capillary action.
Commercially produced garden pots formed of pressed peat provide
a model for observing capillary action in soil.
Directions:
- Measure 50ml of water and pour it in the small dish.
- You will be placing the peat pot in the water, as shown in the
diagram, and will measure, over time, how high the water rises
along the sides of the pot.
- Now place the peat pot in the dish, large end down. Start the
timer and measure the height of the water line above the bottom
of the pot every minute for seven minutes. Record your observations
to the nearest tenth of a cm. in the data table.
|
Time (in minutes)
|
Height of water (in centimeters)
|
|
0
|
0.0 cm
|
|
1.0
|
|
|
2.0
|
|
|
3.0
|
|
|
4.0
|
|
|
5.0
|
|
|
6.0
|
|
|
7.0
|
|
- After 7 minutes, remove the pot and find the volume of the water
that is left in the dish. Calculate the amount of water absorbed
by the pot.
| Amount of water in the dish at time
0.0 |
____________
|
| Amount of water in the dish at time
7.0 |
____________
|
| Amount of water absorbed by the peat pot |
____________
|
- How many milliliters of water did the pot retain in its pore
spaces? __________________
- Calculate the average rate (cm/min) of capillary action for
seven (7) minutes. Show your work in the space below.
|
Rate =
|
distance
_______
time |
Answer ________________ |
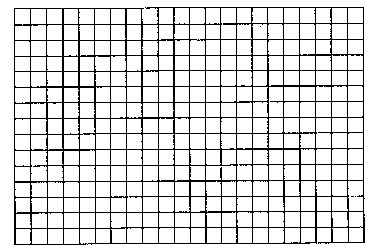
- Draw a line graph of the data using time and height of water
as your variables. Label both axes.

- Using complete sentences, describe the results plotted on your
graph. Include both variables in your description.
- Write a conclusion based on your experiment.
|


