|
Contributed by: New York State Education Department (NYSED)
Task: At this station, you will experiment with four solutions
representing water collected in March 1995 from sources around New
York State to determine their level of acidity.
Materials:
- Solution filled dropper bottles labeled A - D
- pH paper
- pH color chart
- Transparency test card
- Waste cup
- Paper towels
- Safety goggles
- Water for cleaning
Background: 
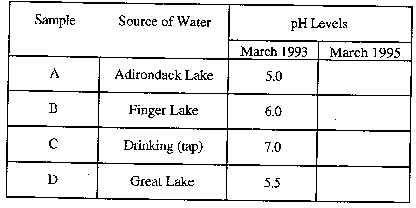
The dropper bottles A through D contain samples that represent
water collected in March 1995 from the following sources:
- Bottle A - Adirondack Lake water
- Bottle B - Finger Lake water
- Bottle C - Drinking (tap) water
- Bottle D - Great Lake water
Directions:
- Put your safety goggles on. DO NOT taste or touch any solution.
Clean up any spills immediately.
- Place one drop of each solution on the transparency circle on
the test card with the same letter as the solution.
- Dip the end of a pH paper into solution A.
- Compare the color of the pH paper with the chart on the pH color
chart.
- Record the pH of the solution on the data table on the answer
sheet.
- Repeat steps 3 through 5 for solutions B, C, and D using separate
unused strips of pH paper for each solution.
- Place used strips of pH paper in the waste cup.
- Clean the transparency test cards with water. Throw any garbage
into the waste cup.
- Answer questions 1 through 4 on the answer sheet.
Answer Sheet
Acid Precipitation
- Record the pH of each sample on the data table below.

- Using the data you have collected and the background information,
determine the following:
- Which 1995 sample is most acidic? (If there is a tie,
list them)
________________________________
- Which 1995 sample is least acidic? (If there is a tie,
list them)
________________________________
The pH of rain water in all of these areas was measured
at 4.5 in 1993 and 3.0 in 1995.
- Compare your results on the data table from 1995 with the
results from 1993.
Which sample(s) was/were most affected by acid rain?
_____________________________________
In the space below, explain the reason for your answer.
________________________________________________________________________
________________________________________________________________________
________________________________________________________________________
________________________________________________________________________
- To survive, many organisms need the water pH to be between
a pH of 5 and 9. The list below shows the lowest pH of water
at which certain organisms can live.
| Bass |
pH 5.0 |
Perch |
pH 4.5 |
Snail |
pH 6.0 |
| Minnow |
pH 6.5 |
|
|
Salamander |
pH 5.5 |
Predict the order in which the organisms in a lake will
die as a lake becomes more acidic.
________________________________________________________________________
________________________________________________________________________
NYS Alternative Assessment in Science Project
Copyright, April 1996
The State University of New York
The State Education Department
Albany, New York 12234
|


