administration student task rubric student work technical quality
 
Snell's Law
Task with Student Directions

Grade 9-12 Performance Task
Developed by: New York State Education Department (NYSED)
University of Buffalo and NORC (1991, revised 1993)

Part A

Introduction:

This laboratory test presents a problem and lists materials available to you. Your task is to design a strategy for solving this problem. Please record all your answer on these sheets. You will have 30 minutes to plan and design an experiment to solve the problem.

Problem:

One of the tests that scientists can use to identify a substance is to measure its index of refraction through the Snell's Law equation. (The index of refraction is equal to the ratio of the sine of the angle of incidence to the sine of the angle of refraction.)

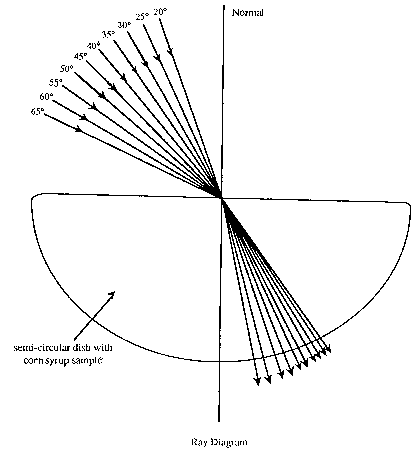
Suppose that you are working for the Consumer Protection Agency and your job is to determine whether the index of refraction of a sample of Corn Syrup meets Federal standards of 1.55. You have been given the data collected by a colleague, and your job is to analyze the ray diagram and determine whether the index of refraction is 1.55 (+ or - 5%).

  1. Under the heading PROCEDURE list in order the steps of the procedure you will use to solve the problem. You may include a diagram to help illustrate your plans for the experiment. Include any safety procedures you would follow.

  2. Construct a DATA TABLE or indicate any other method that you could use to record the observations and results that will be obtained.

  3. At the end of the 30 minutes, your answer sheet for Part A will be collected.

PLEASE NOTE: In Part A, you are NOT to proceed with any part of the actual experiment. You are just to plan and organize a way to investigate the problem.

Materials:

  • Corn Syrup A
  • semi-circular dish
  • graph paper
  • calculator
  • protractor
  • pencil
  • straight pins
  • cardboard
  • ruler
  • graph paper

PART A - Experiment Design

Organize your experiment design under the following headings:
PROCEDURE and DATA TABLE.
Use the front and back of the sheets if necessary.

PROCEDURE


DATA TABLE (For results and observations)


Part B

Introduction:

You will have 50 minutes to complete this part. You have been provided with a detailed Procedure (see below) which you are to follow. Record your work for Part B on the answer sheet under the appropriate headings.

Problem:

One of the tests that scientists can use to identify a substance is to measure its index of refraction through the Snell's Law equation. (The index of refraction is equal to the ratio of the sine of the angle of incidence to the sine of the angle of refraction.)

Suppose that you are working for the Consumer Protection Agency and your job is to determine whether the index of refraction of a sample of Corn Syrup meets Federal standards of 1.55. You have been given the data collected by a colleague, and your job is to analyze the ray diagram and determine whether the index of refraction is 1.55 (+ or - 5%).

  1. Perform the experiment by following the steps outlined in the procedure.

  2. Under the heading RESULTS/OBSERVATIONS record the data collected in the experiment. Use statements, descriptive paragraphs, and tables of data where appropriate.

  3. Under the heading CALCULATIONS show all equations and calculations used.

  4. Construct a GRAPH that shows the relationship between the variables measured.

  5. Under the heading CONCLUSION give an interpretation of your results.

  6. At the end of the 50 minutes, your answer sheets will be collected.

Materials:

  • Corn Syrup A
  • semi-circular dish
  • graph paper
  • calculator
  • protractor
  • pencil
  • straight pins
  • cardboard
  • ruler
  • graph paper

Procedure:

  1. The ray diagram shows the angles of incidence and refraction for Corn Syrup A when a light ray was directed at the semi-circular container.

  2. Measure and record the values for the incident nd refracted angles from the ray diagram.

  3. Compute the vlues for the sine function for these angles.

  4. Plot the values for sin i against the values for sin r and determine the index of refraction from the slope of the graph.


  5. Determine whether the index of refraction is within the limits of:

    1.55 (+ or - 5%). Show all calculations.

  6. Record your answer under Conclusion.

Data Table:

Angle i
Sin i
Angle r
Sin r
20 degrees      
25 degrees      
30 degrees      
35 degrees      
40 degrees      
45 degrees      
50 degrees      
55 degrees      
65 degrees      


Ray Diagram


CALCULATIONS


GRAPH


CONCLUSION

Based on a graphical analysis of the data you collected in this experiment, discuss your conlcusion as to whether the index of refraction of Corn Syrup A meets Federal standards of 1.55. Be certain to explain how you used your data to arrive at this conclusion.


©1997-2005 SRI International. All rights reserved. Terms of Use