| Hydrology
Investigation Tests
(Given data
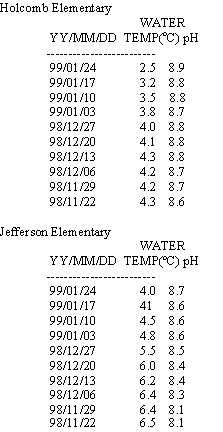
from the GLOBE data archives) GLOBE Data for Holcomb School
and Jefferson School, Fayetteville, Arkansas

(Present problem
requiring use of GLOBE data archives) Holcomb and Jefferson
are two schools located within 5 miles of each other in Fayetteville,
Arkansas. Both schools sit next to the same river, with Holcomb
located upstream from Jefferson. Even though the schools are
relatively close to each other, the plant and fish life appears
to be different between the two sections of the river. You
and several other students have been asked to report to your
science class what some of the differences are and why you
think they exist. To the left is data from the two schools
between late November and late January to help you in your
investigation.
1) (Plan Investigations:
Pose relevant questions) Look at the GLOBE data in the
tables. Think of two questions you might ask regarding the
data. A sample question might be "What is unusual regarding
water temperature between the two schools considering they
take measurements from the same river?
2) (Interpret
GLOBE Data: Infer patterns & trends) One of the students
in your research group, Tom, suggests that you can sometimes
see patterns in the data. Describe one pattern you see in
the pH.
3) (Take GLOBE
Measurements: Use quality assurance procedures) You have
watched some of the students at your school collect GLOBE
data and you've noticed that they have done a very good job.
Just to check, are there any data that look to you to have
errors? How can you tell? What would you tell these students
to insure that measurement errors do not happen?
4) (Interpret
GLOBE Data: Explain data & relationships) One of the students
in your science group, Hilda, remembers in her math class
showing how different variables relate to each other and suggests
doing the same with the GLOBE data. What is the relationship
between water temperature and pH for Jefferson Elementary?
For example, if water temperature increases, what happens
to the pH level?
5) (Interpret
GLOBE Data: Create multiple formats to represent data; explain
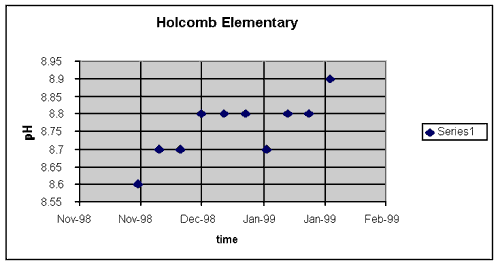
data & relationships) Using the data provided for Holcomb,
create a graph that has time on the x-axis and pH on the y-axis.
Describe what happens to pH as time increases.

6) (Interpret
GLOBE Data: Create multiple formats to represent data; explain
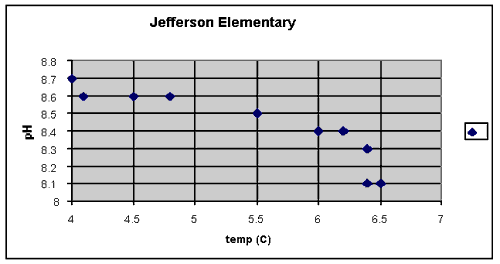
data & relationships) Using the data provided for Jefferson,
create another graph with temperature on the x-axis and pH
on the y-axis. What happens to pH as the temperature increases?

7) (Interpret
GLOBE Data: Explain data & relationships) One of the students
in your science group, Debbie, mentioned that certain pH levels
can affect fish and plant life. If the pH level dropped by
3 in the month of December for either of the schools, what
would be the concern regarding life in the river?
8) (Plan Investigations:
Set up another problem) In the questions so far you have
been looking at water temperature and pH. Randomly choose
another site in the GLOBE database, pick a different variable
that you would investigate, and choose a set of 10 dates in
chronological order for the same time period to use as your
data. Follow the same steps for this data as you did for Jefferson
Elementary and Holcomb Elementary. Why does the new variable
you chose seem interesting to you?
9) (Communicate:
Compose reports to explain or persuade) Using the data
analysis you have done, write a short report (1-2 pages) that
summarizes your findings and explains why you think the plant
and fish life vary between the two schools. Be sure to support
your conclusions with data you have analyzed and suggest other
data that might be helpful for further study of the river.
|

