Contributed by: Council of Chief State School Officers (CCSSO)
Here are examples for each score point ranging from 0 up to
4.
Event Score = 0
Questions
Please answer the following questions by yourself.
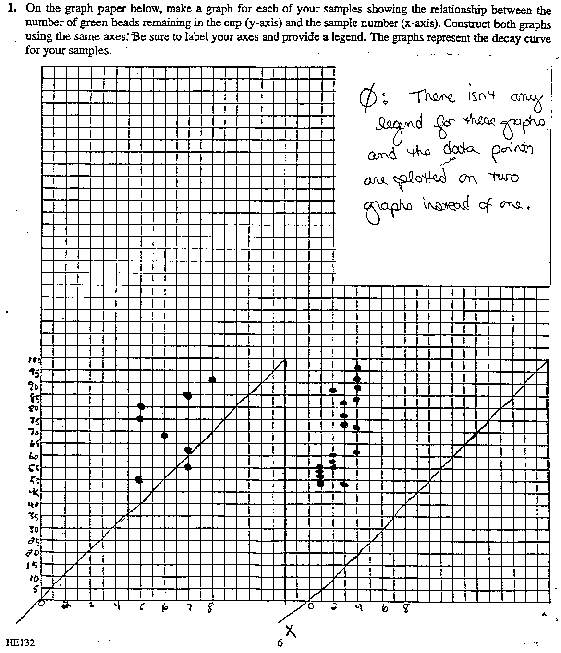
- On the graph paper below, make a graph for each of your samples
showing the relationship between the number of green beads remaining
in the cup (y-axis) and the sample number (x-axis). Construct
both graphs using the same axes. Be sure to label your axes and
provide a legend. The graphs represent the decay curve for your
samples.

- Assume that one minute equals 100 years and that the sample
needs to decay to 1/16 of its original amount to be considered
"safe." You now have to safely dispose of your radioactive samples.
Choose one of your samples. Explain (1) how many years you would
have to be concerned about the radioactivity of the sample, and
(2) how you would dispose of this material. Be sure to justify
your responses.

|


