Grade 5-8 Performance Task
Contributed by: New York State Education Department (NYSED)
NYS Alternative Assessment in Science Project (1996)
Student #2

_____________________________________________________________________________________________
Task:
At this station, you will observe and analyze
a model of the interaction between the Earth's crust and upper
mantle.
Materials:
- 1 250 mL beaker containing glop
- 1 timer
- 1 ring stand
- 1 test tube clamp
- 1 test tube with scale

Background:
Some geologists believe the theory that there is
a semi-fluid layer 100 to 300 kilometers below the Earth's surface.
Due to high temperature and pressure, the rock in this region
behaves both like a solid and a liquid. Slow movements in this
region are thought to be related to changes in the upper crust
and to fractures in the Earth's surface. The model in this activity
may demonstrate how these changes can occur.
Directions:
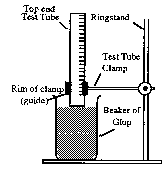
- Set up the equipment exactly as it appears in the diagram
above.
- Before installing the test tube clamp on the ring stand,
adjust the opening of the clamp so that the test tube will
slide easily through it. **The clamp will not be used to hold
the test tube, but rather to guide its movement.**
- Place the test tube within the clamp and directly over the
glop in the beaker. Hold the test tube above the glop, but
do not allow it to rest on the glop yet.
- Turn the test tube so that the lines and numbers can be
read easily.
- Carefully hold the test tube so that it just touches the
surface of the glop. Using the bottom rim of the clamp as
your guide, make sure that the scale on the test tube reads
zero.
- Release the test tube and start the timer.
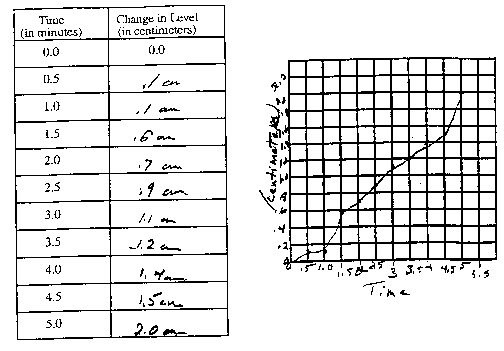
- Read the level of the test tube to the nearest tenth of
a centimeter every half minute. For each reading, record the
level using the rim of the clamp as your guide (refer to above
diagram). Take readings for a maximum of 5 minutes.
- Record your observations regarding the level of the graduated
test tube in the table below. Make a line graph of your data
using time and change in level as your variables. Label both
axes. Include proper units.

9. Assume that your data is an accurate model for
the behavior of a mountain range such as the Himalayas or the
Adirondacks. How would the rate of sinking of the mountains
early in their formation compare with the rate late in their development?
Answer in complete sentences.

10. Based on your observations of this model, explain
one possibility why the crust is usually pushed deeper into the
earth below old mountains than under newly formed mountains. Answer
in complete sentences.

11. List at least three factors in the natural world
that have not been accounted for in this model.


