|
Grade 5-8 Performance Task
Contributed by: New York State Education Department (NYSED)
NYS Alternative Assessment in Science Project (1996)
Student #2

Task:
In this activity, you will be reading and interpreting
the information from a barograph from a major winter storm.
Background:
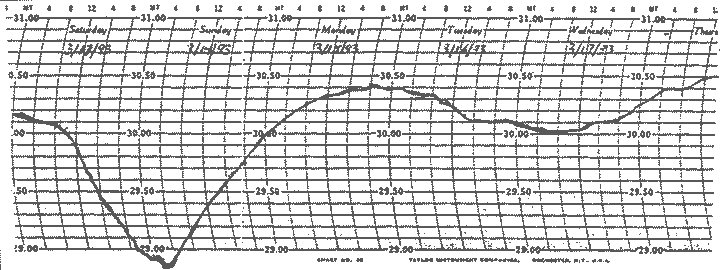
Over the weekend of March 13 & 14, 1993, over
two (2) feet of snow fell over much of New York State. A barograph
continuously recorded the air pressure during the storm. The chart
shows the air pressures as recorded by that barograph.

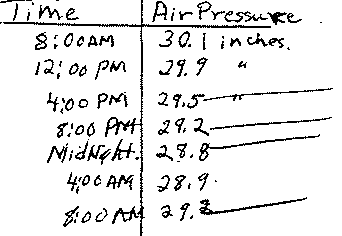
1. In the space below, make a table of the barometric
pressures from the barograph at four hour intervals.
Start the table at 8:00 am on Saturday and end with 8:00 am on Sunday.
Record the barometric pressures to the nearest tenth of an inch.

2. A very distinct front passed through this region. On which day
and time did it arrive?

3. What observations from the graph led you to your conclusion
in question #2?

4. During which four hour period was the wind velocity the greatest?

5. Using complete sentences, describe how you used the barograph
to determine your answer to question #4.

6. Using complete sentences, describe the relationship between
air pressure and air temperature between 8:00 pm on Saturday and
8:00 am on Sunday.

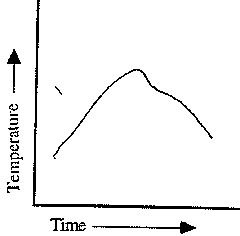
Draw a line graph of the likely temperature pattern during the
time period described in question #6.

|

