|
Contributed by: Council of Chief State School Officers (CCSSO)
In the anchor set, there is one example for each score point ranging
from 1 up to 4 for questions 1 and 2.
In the discussion set, there is one example for each score point
ranging from 1 up to 4 for questions 1 and 2.
Anchor Set
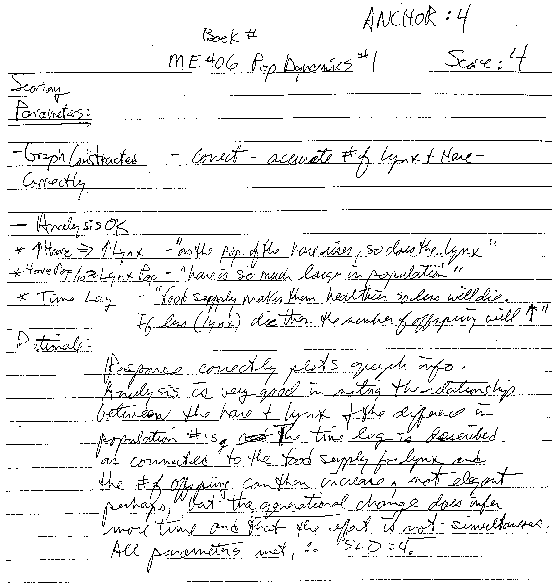
Item 1 - Event Score = 4
Questions
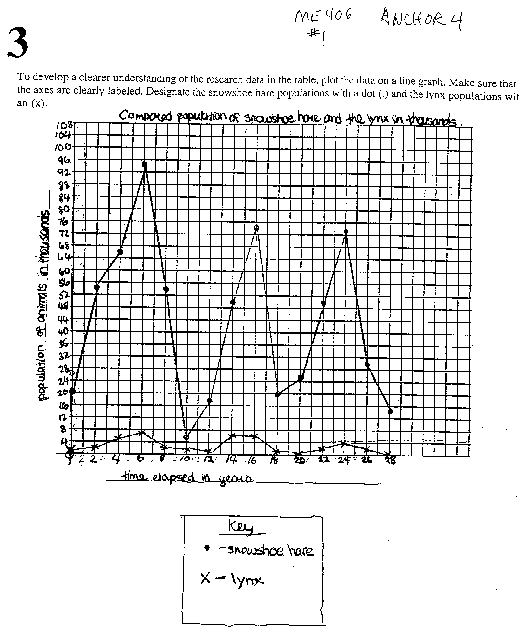
To develop a clearer understanding of the research data in the
table, plot the data on a line graph. Make sure that the axes are
clearly labeled. Designate teh snowshoe hare populations with a
dot (.) and the lynx populations with an (x).

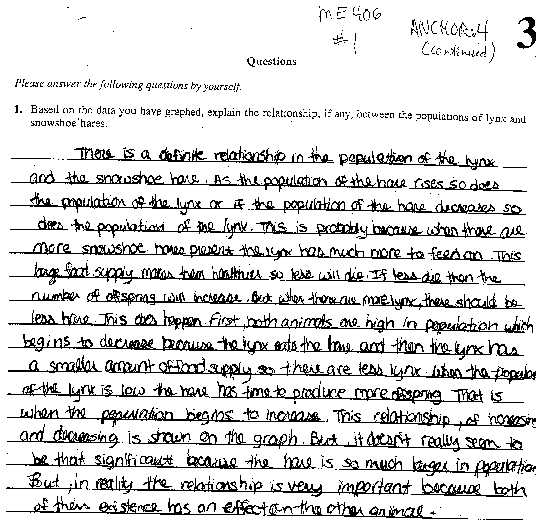
Please answer the following questions by yourself.
- Based on the data you have graphed, explained the relationship,
if any, between the populations of lynx and snowshoe hares.


|

