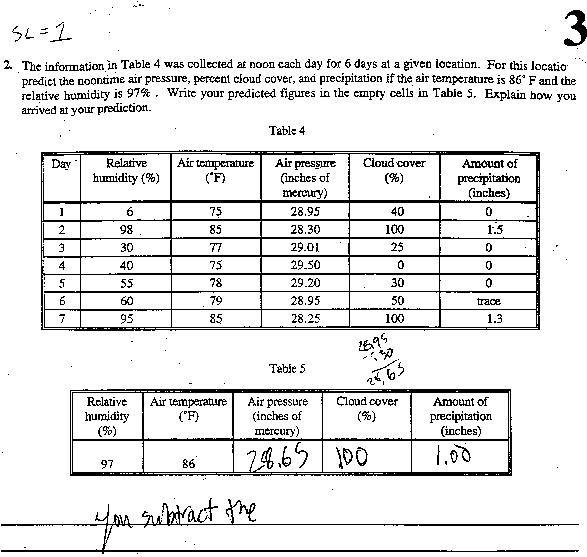
| Shown In table 5:
Cloud Cov = 100
28.95
- .30
28. 65
"you subtract the"
No development of the response is shown.
|
One prediction correlates with data in the table.
Some work is shown about how the (incorrect) prediction
for Air Pressure was determined, but it is incomplete and
unexplained.
There is no explanation of how changes in factors influence
each other; No development of concepts or any other indicators
of student understanding of the interaction between weather
factors in predicting the weather.
|
The prediction for air pressure should be corrected
from 28.65 given in the response to something below 28.25;
The prediction for precipitation should be corrected from
1.00 given in the response to something between 1 and 2
inches showing an increase from the value 1.3 given for
day 7.
Some statement should be made of how the data in the weather
log indicates that the different weather factors exhibit
influences on each other.
Concepts related to the question (e.g. relative humidity;
air pressure, etc.) could be explained; terms could be clarified;
examples from the weather log could be cited; connections
between the factors could be made and explained.
|