|
Grade 5-8 Performance Task
Contributed by: New York State Education Department (NYSED)
NYS Alternative Assessment in Science Project (1996)
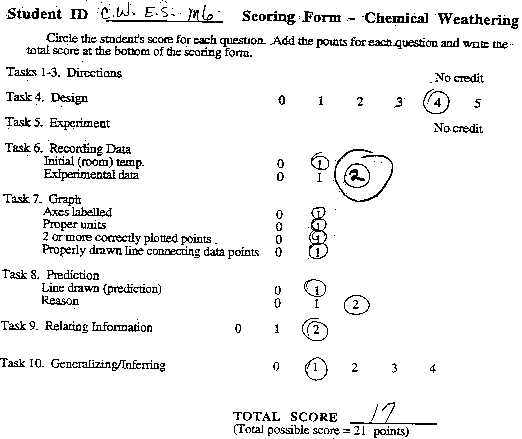
Student #2


Task:
At this station you will be observing a model of chemical
weathering processes.
Materials:
- 3 clear plastic cups (with 100 mL line marked)
- hot water (45-50 degrees Celsius)
- room temperature water
- paper towels
- 1 thermometer
- 4 effervescent antacid tablets
- ice water
- waste container
- 2 Styrofoam or insulated cups (for transfer of hot liquid)
Background:
What effect does water temperature have on the rate of a chemical
reaction similar to the interaction of a weak acid and carbonate
rock, such as limestone or marble? To examine this question, you
will observe a model that simulates the interaction of water and
limestone. The "limestone" in your model will be an
effervescent antacid tablet. This tablet will dissolve in water
much more quickly than the limestone in nature, making it possible
for you to collect data during this task.
Directions:
- Put 100 mL room temperature water into the marked, clear cup
and record its temperature on the data table.
- Set your timer to zero or watch the wall clock. Place one tablet
into the cup of water. Measure the time it takes for the tablet
to dissolve completely and record this time on the data table
on the next page.
- Using only the materials listed above, design a controlled
experiment to determine the effect of temperature on the rate
of chemical weathering.
- In the space below, write out the steps you will follow in performing
a controlled experiment. Be specific enough so that another student
could follow your directions and successfully complete the experiment.

5. PERFORM YOUR EXPERIMENT. However, do not use water
with a temperature above 50 degrees Celsius.
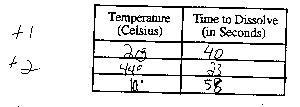
6. Summarize all your data on the data table below.

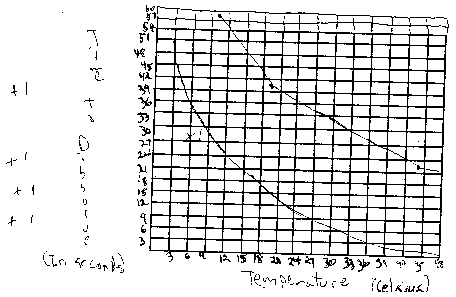
7. Use the data from the table to construct a graph. Graph your
data using temperature and time as your variables. Label both axes.

8. If this experiment was repeated with the antacid tablets ground
into a fine powder, draw a dashed line on the graph
that you think would show the result. In the space below, use complete
sentences to explain why you placed the line where you did.

9. If this activity was an accurate model of the actual chemical
weathering of rock material on the Earth, how would climate temperatures
affect the rate of chemical weathering of rock surfaces? Answer
in a complete sentence.

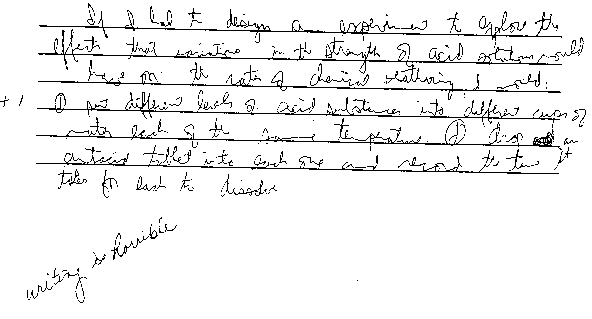
10. Describe how you would design an experiment to explore the
effects that variations in the strength of weak acid solutions would
have on the rate of chemical weathering? Include at least 4 variables
that you would consider.

|

