 |
 |
|
|
|
|
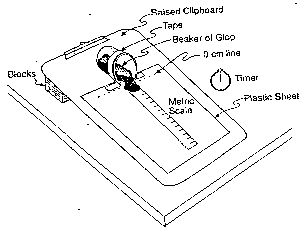
Grade 5-8 Performance Task Task:At this station, you will observe, measure, and graph a model of slow downslope movement. Description:Mass wasting is the name for all of the earth processes by which gravity pulls materials down. Some of the processes, like landslides and avalanches, are rapid, while other, like soil creeping, occur so slowly that observations are difficult to obtain. Materials:
Directions:
Student Answer Sheet1. Use the data table to record your observations to the nearest tenth of a centimeter per half minute. 2. Draw a line graph of the data using time and distance as your variables. Label both axes.
3. a. Calculate the rate of movement of the glop during the first
three minutes of observation to the nearest tenth of a cm/min. Show
your work.
Answer _____________ b. Calculate the rate of movement of the glop during the last
three minutes to the nearest tenth of a cm/min. Show your work.
Answer _____________ 4. a. Compare the rates of movement for the first three minutes and the last three minutes of observation. Using complete sentences explain why they are or are not the same.
b. How does your graph show the similarities or differences in rates that you calculated in question 3? In complete sentences, explain how your graph displays the rates. 5. a. Material that is more liquid will move downhill faster than material which is "stiffer", (less fluid or more viscous). Where would the line for a more liquid material be located on the graph? b. This activity presented a model for downslope movements like mudflows, soil creep, or glacier activity. In nature, what could happen to increase the rate of movement of sediment or ice in these earth features. |
