|
Contributed by: New York State Education Department (NYSED)
Task: At this station, you will experiment with five solutions
representing water collected in March 1995 from sources around New
York State to determine their level of acidity.
Materials:
- Solution filled dropper bottles labeled A - D
- pH paper
- pH color chart
- Transparency test card
- Waste cup
- Paper towels
- Safety goggles
- Water for cleaning
Background: 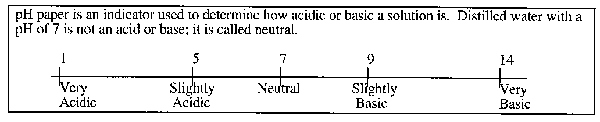
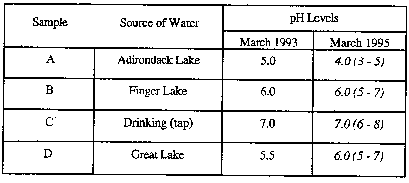
The disposable pipettes A through D contain samples that represent
water collected in March 1995 from the following sources:
- Pipette A - Adirondack Lake water
- Pipette B - Finger Lake water
- Pipette C - Drinking (tap) water
- Pipette D - Great Lake water
You will test the water samples collected in March 1995. Results
from these samples will be compared with water collected in March
1993 from these same locations.
Directions:
- Put your safety goggles on. Do not taste or touch any solution.
Clean up any spills immediately.
- Place one drop of each solution on the transparency circle with
the same letter as the solution.
- Dip the end of a pH paper into solution A.
- Compare the color of the pH paper with the pH color chart.
- Record the pH of the solution on the data table on the answer
sheet.
- Repeat steps 3 - 5 for solutions B through D using
separate unused strips of pH paper for each solution.
- Place used strips of pH paper in the waste cup.
- Clean the transparency test cards with water. Throw any garbage
into the waste cup.
- Answer questions 1 through 4 on the answer sheet.
Answer Sheet
Acid Precipitation- Micro
- Record the pH of each sample on the data table below.
- Using the data you have collected and the background information,
determine the following:
- Which 1995 sample is most acidic? ________________________________
(If there is a tie, list them)
- Which 1995 sample is least acidic? ________________________________
(If there is a tie, list them)
The pH of rain water in all of these areas measured
at 4.5 in 1993 and 3.0 in 1995.
- Compare your results from 1995 with the results from 1993.
Which sample(s) was/were most affected by acid rain?
_____________________________________
In the space below, explain the reason for your answer.
________________________________________________________________________
________________________________________________________________________
________________________________________________________________________
________________________________________________________________________
- To survive, many organisms need the water pH to be between
a pH of 5 and 9. The list below shows the lowest pH of water
at which certain organisms can live.
| Bass |
pH 5.0 |
Perch |
pH 4.5 |
Snail |
pH 6.0 |
| Minnow |
pH 6.5 |
|
|
Salamander |
pH 5.5 |
Predict the order in which the organisms in a lake will
die as a lake becomes more acidic.
________________________________________________________________________
________________________________________________________________________
NYS Alternative Assessment
in Science Project
Copyright, April 1996
The State University of New York
The State Education Department
Albany, New York 12234
|

